Our Dashboards
Place Based Dashboards
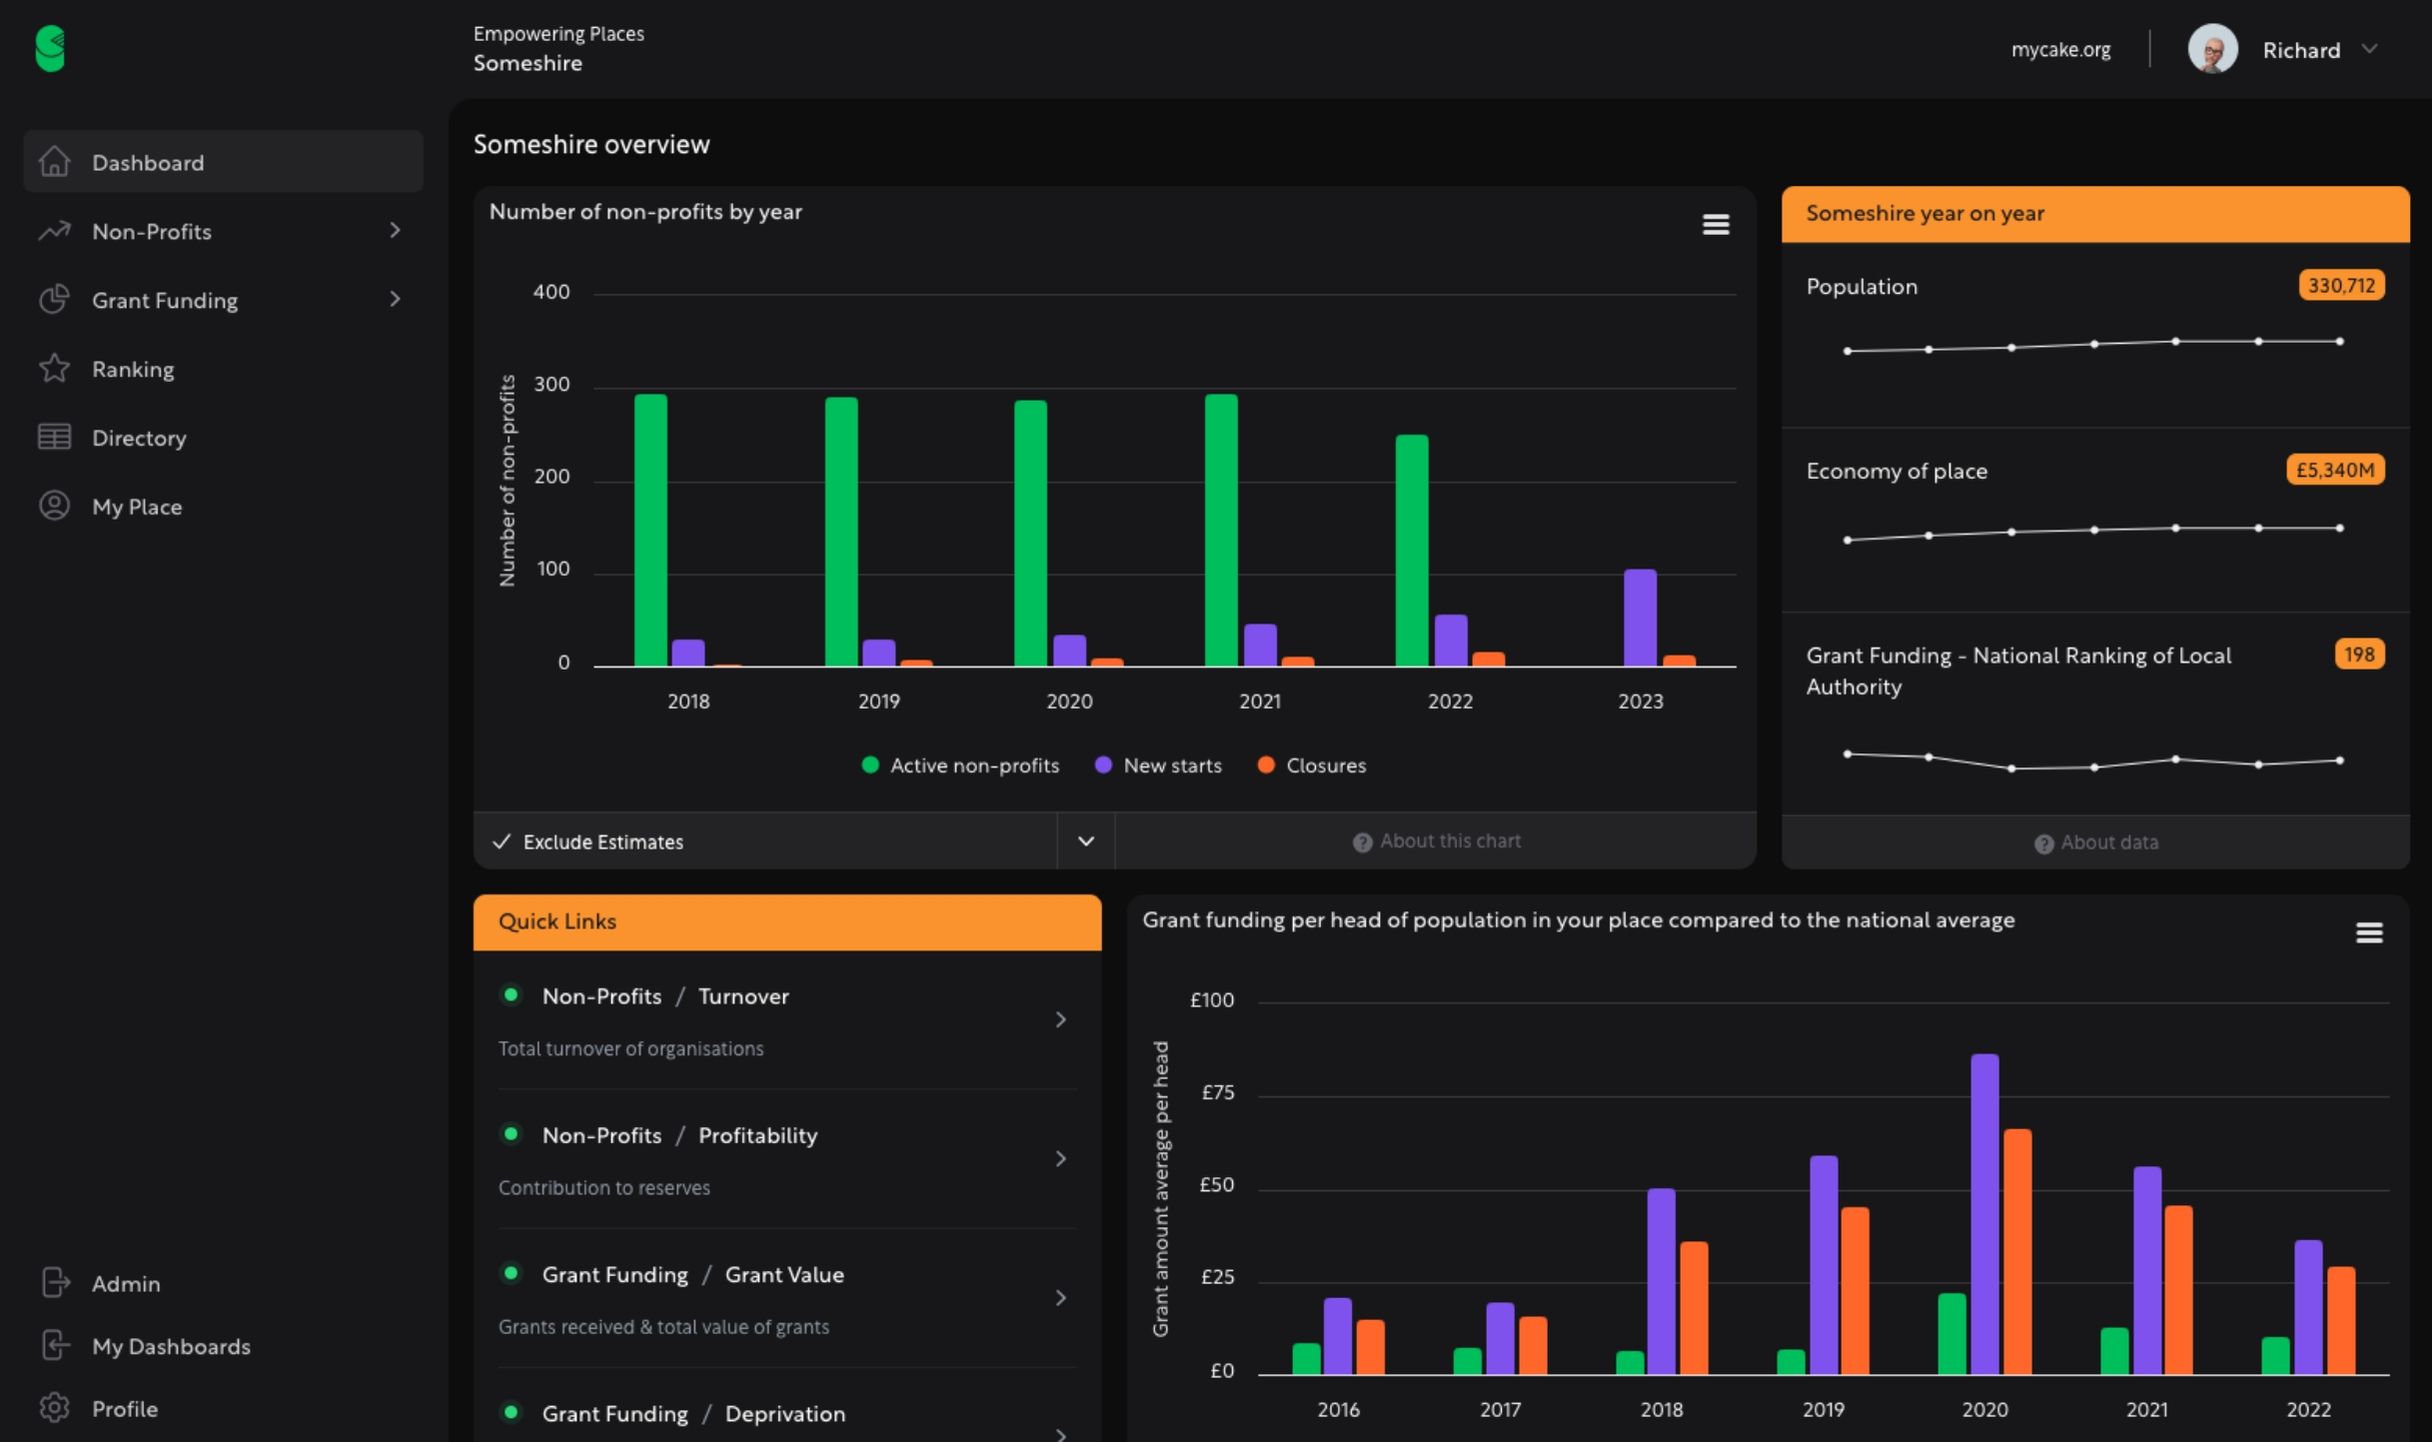
Empowering Places
These dashboards enable you to explore the shape and size of the VCSE sector in any given place in the UK. We slice the data by sector, deprivation, turnover, surplus and ward. In addition to exploring all the registered non-profits in your area we also include data on the grants received from public funders such as the Lottery and arms length bodies and private trusts & foundations. These dashboards enable you to answer questions about the size and financial health of the sector in your place and see how this is changing over a five year period.
Create your own benchmarking tool
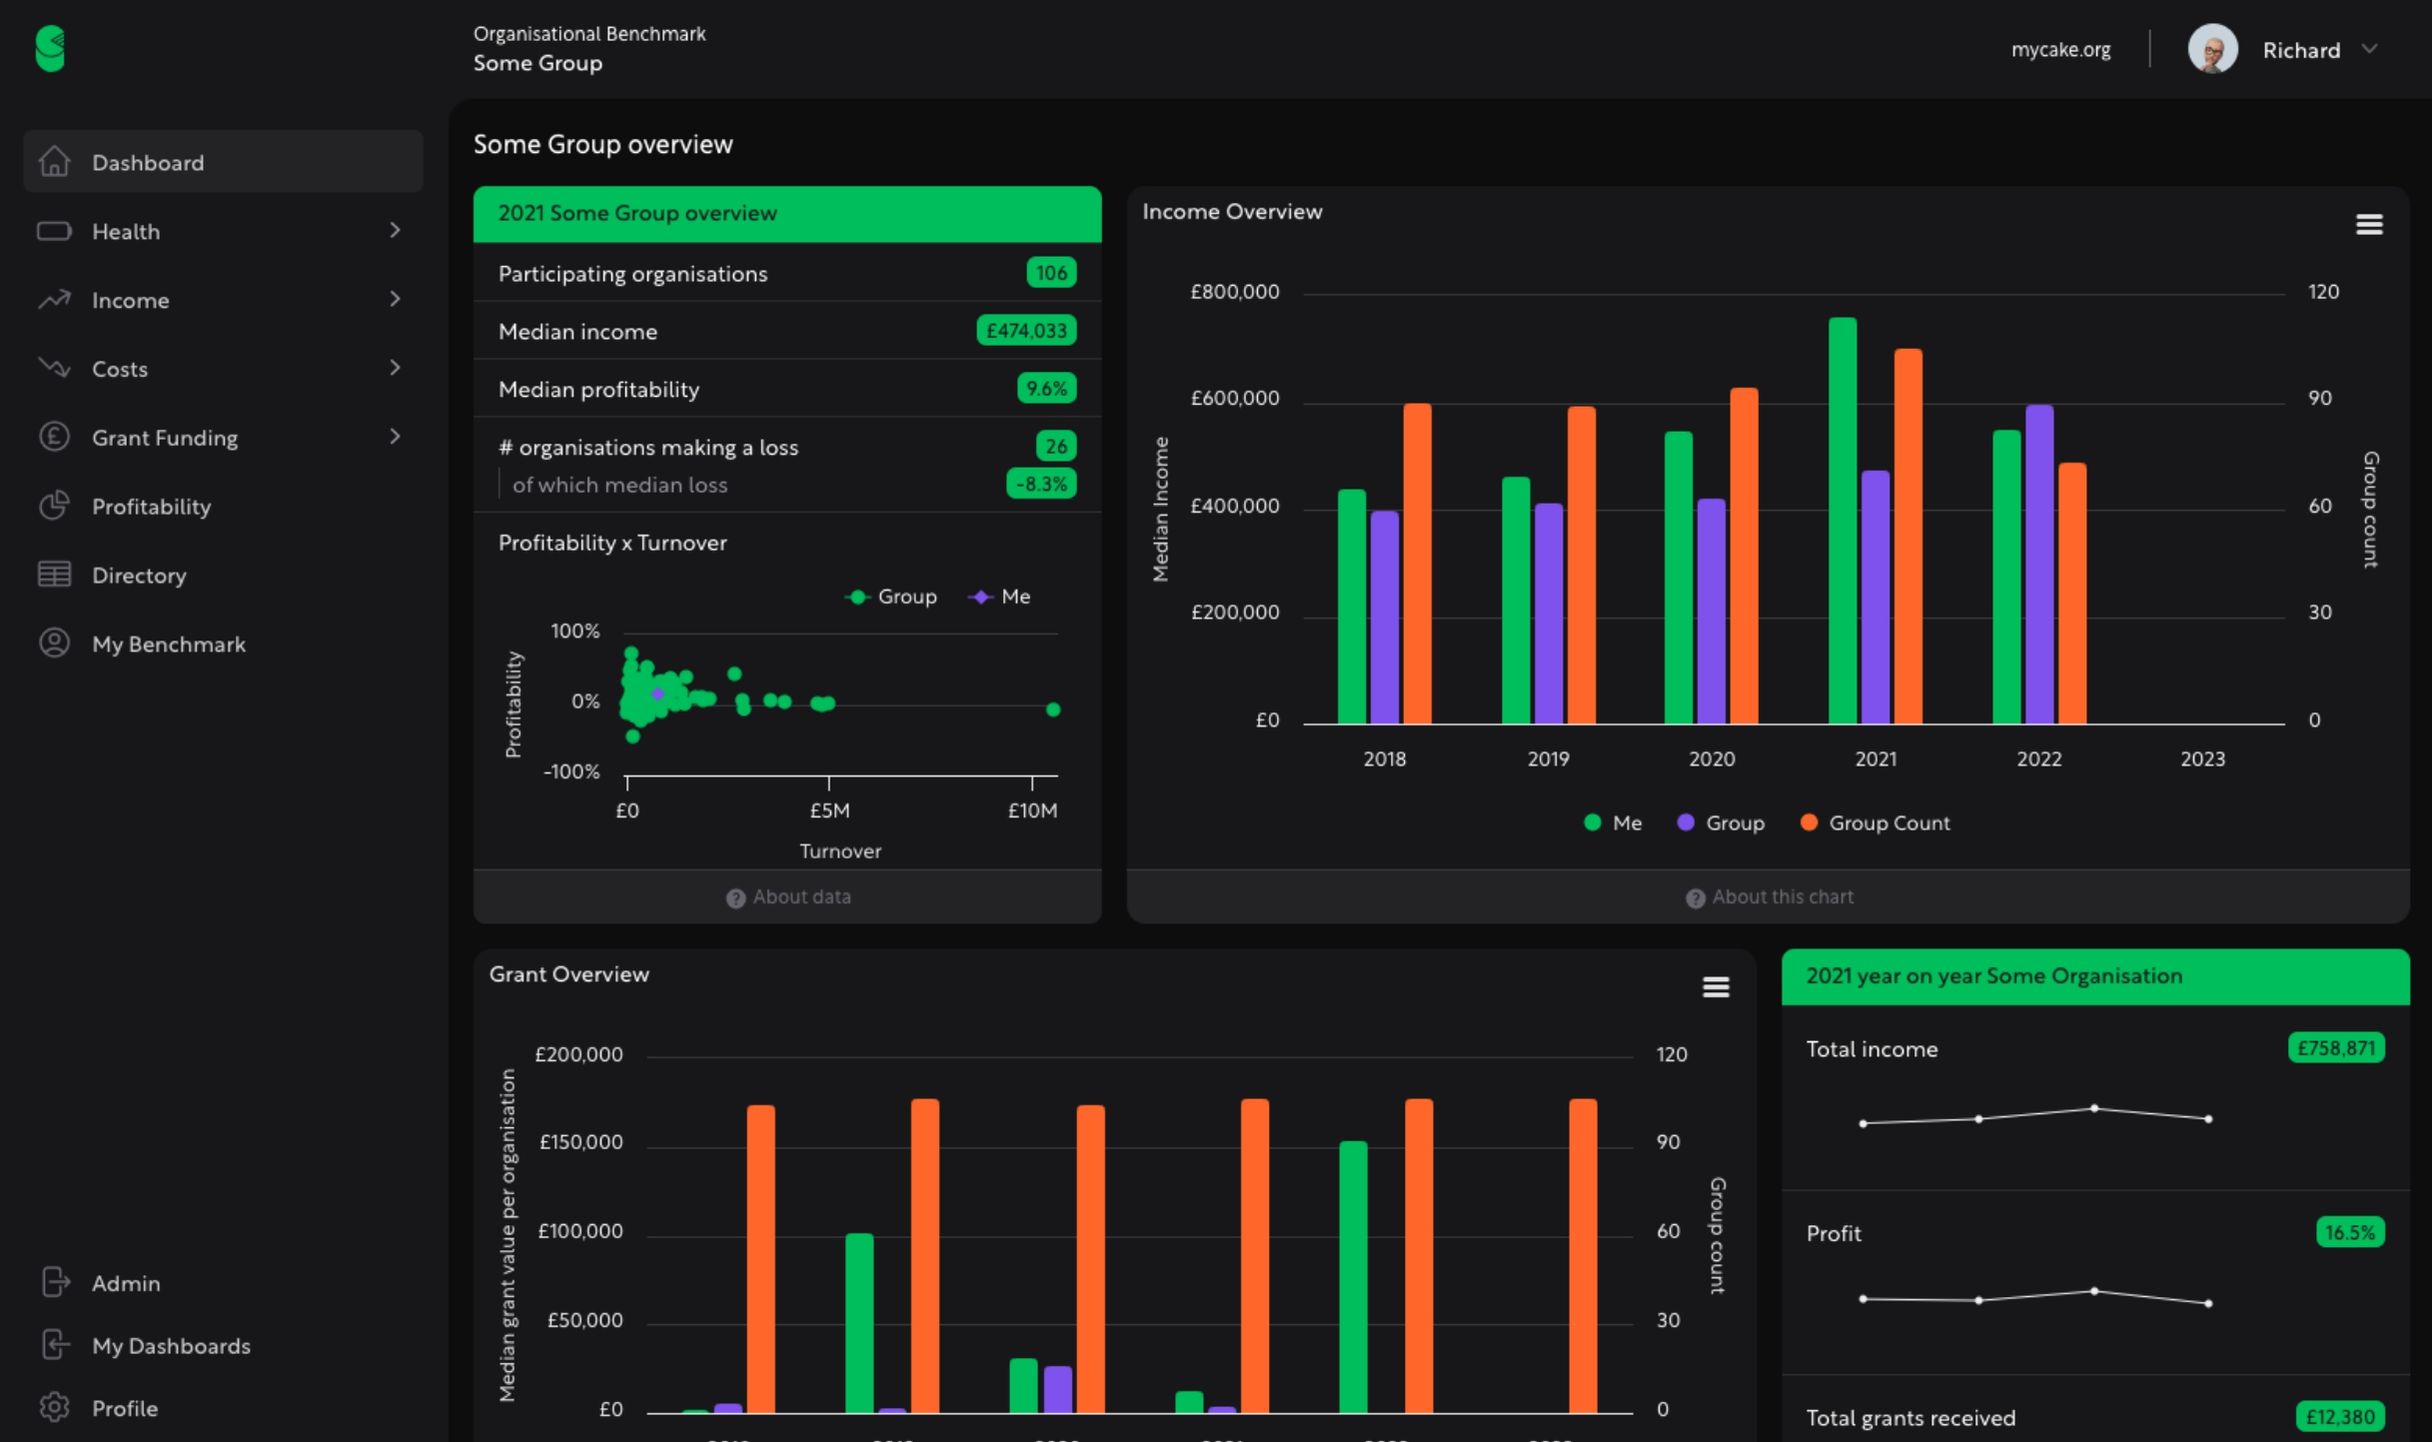
Organisational Benchmark
The MyCake Benchmark enables you to compare your organisation’s financial results against one or more groups of similar organisations. We provide a series of key financial metrics with which to evaluate the financial health of your organisation and then benchmark this against one or more peer groups. The dashboards show a mix of single year results and five year trends. We also provide benchmarks of the grant income sources for these benchmark groups so that you can see where organisations of a similar shape and size have won funding.